Langley's housing market in October: prices are down, but townhouses are quietly busy
Every type of Langley home is worth less than a year ago, but townhouse sales jumped a quarter in a month while detached sales here fell far harder than in the rest of the Valley. Here is what the October numbers say, and what the rate hike changes.
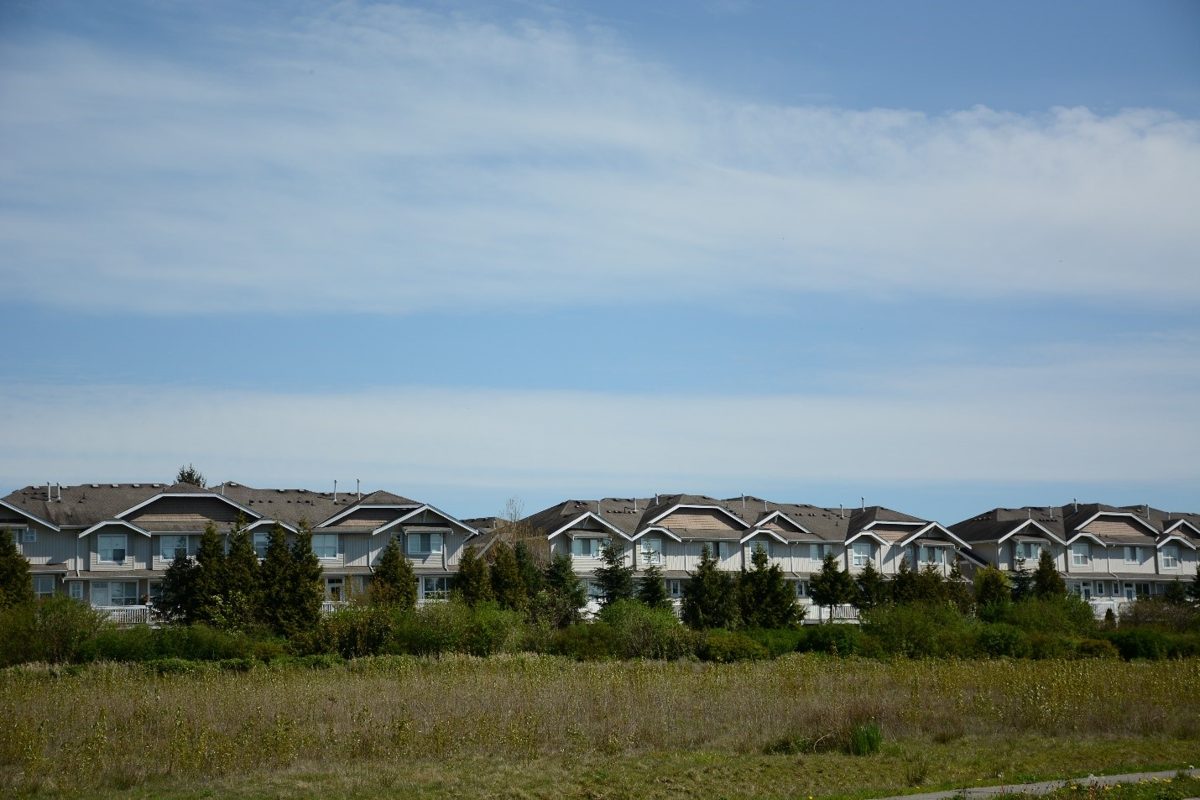
The short version is the one you’ve probably already heard: Langley homes are worth less than they were a year ago. Detached, townhouse, condo — every category is lower than last October.
But the full monthly numbers from the Fraser Valley Real Estate Board tell a more interesting story than “still slumping.” One part of Langley’s market is moving fast. Another is having a much rougher year here than in the rest of the Valley. And the Bank of Canada just changed direction on interest rates.
We went through the board’s October statistics package line by line. Here’s what’s in it.
October in Langley, at a glance
| Detached | Townhouse | Condo | |
|---|---|---|---|
| Sales | 59 | 76 | 60 |
| vs. Oct 2025 | down 25% | up 7% | down 20% |
| vs. Sept 2026 | down 8% | up 25% | down 10% |
| Benchmark price | $1,448,100 | $800,600 | $522,300 |
| Change in a year | down 6.5% (about $100,000) | down 3.7% (about $31,000) | down 8.4% (about $48,000) |
| Median sale price | $1,300,000 | $772,444 | $438,825 |
| Active listings | 434 | 260 | 404 |
Source: Fraser Valley Real Estate Board, MLS® Summary and Home Price Index, October 2026. “Langley” covers both the City and the Township.
Across all home types, Langley’s benchmark price is now $932,900, down 5.7% from a year ago.
The townhouse story
Townhouses were the only kind of home in Langley that sold more this October than last. And from September to October, townhouse sales jumped by a quarter, while detached and condo sales both slipped.
There’s a handy way to gauge how hot or cold a market is: divide sales by the number of homes for sale. The board calls 12% to 20% “balanced.” Below that, buyers have the upper hand. Above it, sellers do.
Running that math on Langley’s October numbers:
- Townhouses: about 29%. That’s well past “balanced” and into territory that usually favours sellers.
- Condos: about 15%. Balanced.
- Detached: about 14%. Balanced, near the low end.
Compare that to the whole Fraser Valley at 11%, which the board calls a buyer’s market. Townhouses have also held their value best in Langley. They’re the only type of home here priced higher than five years ago (up 6%), and they’re also the fastest to sell across the Valley, at 37 days on average.
Why townhouses? We’ll leave the crystal ball to the economists, but the math is easy to see. A Langley townhouse costs roughly $650,000 less than a detached home and gives you more room than most condos. That makes it the obvious “first real family home” for many people. Willoughby, Yorkson, Walnut Grove and Murrayville have plenty of them.
Detached homes: Langley is the outlier
Across the whole Fraser Valley, detached sales actually went up a little in October compared to last year (up 1.6%). The board’s chair said detached homes “continued to lead sales activity.” Abbotsford’s detached sales jumped by a third.
Langley went the other way: 59 detached sales, down from 79 a year ago.
One likely factor is price. Langley’s detached benchmark is about $154,000 above the Fraser Valley average and more than $350,000 above Abbotsford’s. When buyers are watching every dollar, that gap matters. Abbotsford’s detached prices have also dropped further (down 13% in a year versus 6.5% here), so the deals there may simply look better on paper right now.
If you’re a Langley detached homeowner, there’s a silver lining. Prices here haven’t fallen as hard as in many neighbouring markets, even though sales have.
Condos: fewer for sale, and cheaper when they do sell
Langley condo listings dropped sharply. There were 404 for sale in October, down 27% from a year ago. That’s the biggest drop of any home type.
At the same time, the median condo sale price fell about 20% year-over-year, to $438,825. That figure is the middle sale of the month. It sits well below the benchmark price of $522,300. In plain English, the condos that did sell were mostly at the more affordable end: smaller, older or farther from the action.
Five years later: the pandemic bump is mostly gone
The board’s CEO, Rock Lefebvre, said it plainly in the October release: “Much of the pandemic-era price growth in the Fraser Valley has been erased.” He said affordability is at its best level in five years.
Langley’s numbers back that up:
- Detached: down 7.2% from five years ago, and down 10.8% from three years ago
- Townhouse: up 6.0% from five years ago
- Condo: basically flat (up 0.5%) over five years
- All homes combined: down 4.9% over five years
Take a longer view, though, and the picture changes. Over ten years, Langley’s overall benchmark is still up almost 38%, and detached homes are up 57%. Someone who bought in 2016 is still well ahead. The people feeling it most are the ones who bought near the 2022 peak.
The rate wildcard
This is the part that’s new. On October 28, the Bank of Canada raised its key interest rate by a quarter point, to 2.5%. It was the first hike in more than three years. The Bank pointed to energy prices tied to the Middle East conflict pushing up inflation, which hit 3.1% in September.
Canada’s big banks moved their prime rate up to 4.70% right after. If you have a variable-rate mortgage or a home equity line of credit, your cost of borrowing has already gone up.
The Bank said it will decide “one meeting at a time.” Its next decision is December 9, 2026, and some forecasters expect at least one more hike.
So buyers are looking at the lowest prices in years and borrowing costs that are rising again, both at the same time. The board’s CEO said buyers “will need to consider how borrowing costs factor into their purchasing decisions.”
What it means for you
We’re not realtors or financial advisors, and this isn’t advice. Here’s how the numbers look from different spots:
If you’re buying: Detached homes and condos in Langley sit in balanced territory with room to negotiate, and prices are back near where they were in 2021. Townhouses are a different story. With fewer listings and steady demand, don’t assume you’ll get a big discount on a good one.
If you’re selling: Pricing matters more than it has in years. Sellers are listing less (Langley’s active listings are down in every category), which helps a bit. But buyers have time to compare, especially for detached homes, which took 50 days on average to sell across the Valley.
If you’re staying put: Your home’s “value” matters on paper, but your mortgage renewal date and rate type likely matter more right now. With the December 9 rate decision coming, it’s worth knowing when your term is up.
If you’re thinking about moving to Langley: Our Living in Langley guides walk through each community, and the buying a home in Langley guide covers transfer tax, first-time buyer help and the checks that matter here (floodplain, ALR, suites, septic). For the townhouse-heavy areas, see buying in Willoughby and buying in Yorkson.
How to read these numbers (a quick decoder)
- Benchmark price: The board’s estimate of what a “typical” home costs, built from the features of homes in the area. It’s the best number for spotting trends because it isn’t thrown off by one month of unusual sales.
- Median price: The middle sale of the month. When it’s well below the benchmark, it usually means more of the month’s sales were cheaper homes.
- Sales-to-active ratio: Sales divided by homes for sale. Between 12% and 20% is balanced, according to the board. Our Langley ratios above are calculated from the board’s own published figures.
- “Langley”: The board reports the City of Langley and the Township together as one area, so these numbers cover Aldergrove, Brookswood, Fort Langley, Walnut Grove, Willoughby, Murrayville and the rest.
- Fall is slower: Sales usually dip in autumn and pick up in spring, so compare October to last October rather than to June.
The board releases new numbers early each month. We’ll keep tracking how Langley compares, especially after December 9.